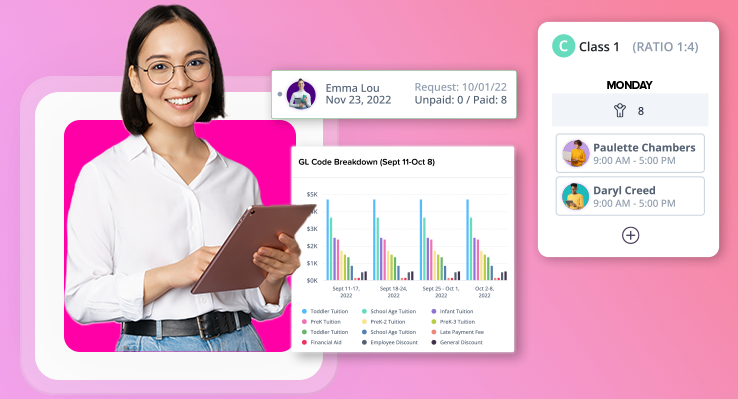
Data and analytics have been used across industries and businesses for decades to determine trends and predict future behaviors. By bringing this approach to childcare, owners and directors will have more insight within and across their businesses, allowing them to make more informed decisions.
With this insight, business leaders are signaled to take action and make effective changes. In this article, we’ll outline how to start analyzing the data you have, how to recognize trends, and how to use this insight to grow and better understand your business.
Analyzing Data
To start analyzing the data you have, either look to your childcare management software or start building a spreadsheet. Here is an example of a modeling tool built to help you forecast attendance, visualize finances based on tuition changes, check your center’s performance against benchmarks, and more.
To understand what data you’re looking for, figure out what questions you’re trying to answer. For example:
- What would my revenue look like if I increased my tuition rates by 10%?
- How often does a particular staff member call off?
- Which families have a pattern of paying late?
Once you know what you’re looking to achieve, you can start scanning the data for answers. Most likely, you’ll find interesting information and insights you weren’t even looking for.
Benchmarking
When looking through your reports and spreadsheets, you might wonder how your center’s performance compares to the rest of the industry. This is where benchmarking comes in. Compare your center’s data to these metrics to understand where you can improve.
- Occupancy: 70-90%
- Staff Costs: 50-55% of your income
- Operating costs: 11-13% of your income
- Facility costs: 22-25% of your income
- Profit: 15-30% of your income
These benchmarks represent a healthy childcare business and are courtesy of Hinge Early Education Advisors.
Making Informed Decisions
Once you analyze and benchmark your data, you can understand where you can improve your business. Let these insights inspire you to take action. For example:
- Add new revenue streams.
- Drop-in childcare
- Summer camps
- School-age programs
- Identify staff roles that can be added or removed.
- Combine eligible classrooms.
- Eliminate discounts.
- Implement late fees.
- Reward on-time employees.
Use these ideas to solve problems and propel your business forward. For more information on analytics from Kangarootime, watch our recent webinar.


